A note on how this was put together: all data and sources came from my own research, primarily through Google searches filtered through Ground News to stick with center-leaning outlets. I used Claude to review the final draft for grammatical accuracy and to generate the Python code for the plots. I modified the styling to match my site’s theme and used Google Slides for some of the charts for easier formatting.
As I write this, Brent crude is above $110 a barrel. The Strait of Hormuz, through which 20% of the world’s oil flows, has been effectively shut down following a regional conflict in the Middle East. Oil traffic through the strait has fallen to less than 10% of pre-war levels. It is one of the largest supply disruptions in the history of the global oil market.
If you needed a reminder that the world still runs on oil, you got one.
Global oil consumption hit a record in 2024 and kept climbing into 2025 and 2026, averaging approximately 104.4 million barrels per day so far in 2026. Two decades of climate summits. A $2.2 trillion annual clean energy investment boom. Nearly 60 million electric vehicles on the road. And we burned more oil than in any prior year.
Oil’s share of the global energy mix dipped below 30% for the first time. But in absolute terms, demand keeps rising. The gap between the energy transition narrative and the energy transition reality remains wide. I went through the data to understand where oil actually sits in the global system: who produces it, who controls it, how it moves, and what might change the picture. Then a war broke out that made every one of these structural dependencies viscerally real.
Oil’s grip on transportation
The transport sector consumes roughly 60% of all oil burned globally. Oil supplies approximately 91% of transport energy, according to the IEA. That figure was about 95% in 1970. In 55 years, the world has shaved off roughly four percentage points.
The breakdown by mode explains why progress has been so slow.
Aviation is effectively 99%+ oil-dependent. The IEA notes that Sustainable Aviation Fuels (SAF) account for less than 0.1% of all aviation fuels consumed today. Planned SAF projects meet only 2% to 4% of jet fuel demand by 2030.
International shipping runs on 99%+ oil. Oil products have historically accounted for more than 99% of total maritime energy demand. As of 2022, biofuels met less than 0.5% of global shipping energy demand.
Road transport, the biggest slice at roughly 44 to 48 million barrels per day (mb/d), remains around 91% oil-dependent. Passenger cars are electrifying, but light-duty vehicles share the road with diesel trucks, buses, and motorcycles that still overwhelmingly burn liquid fuel.
Rail is the one bright spot. In 2022, diesel made up 53% of rail energy consumption and electricity 45%. But rail accounts for only about 1% of total transport emissions (IPCC, 2019), so its contribution to total oil displacement is modest.
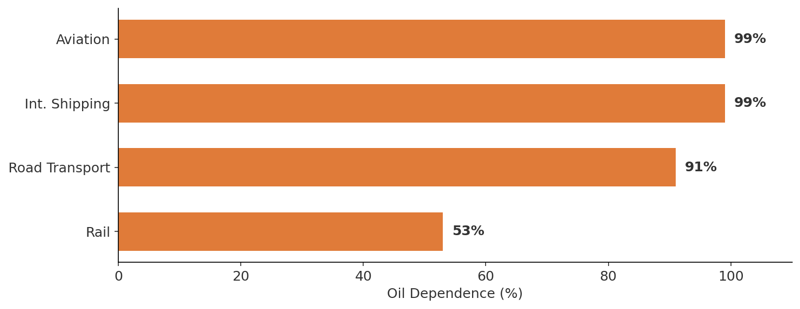 Oil dependence by transport mode. Aviation and shipping remain almost entirely oil-powered. Data: IEA.
The electric vehicle push
Electric vehicle (EV) adoption has accelerated from niche to industrial priority. Global EV sales exceeded 17 million units in 2024 and are projected to surpass 20 million in 2025, capturing roughly one quarter of all new passenger car sales. The global electric car fleet reached almost 58 million at the end of 2024, according to the IEA’s Global EV Outlook 2025. That represents about 4% of the total passenger car fleet.
In 2024, electric cars displaced more than 1 mb/d of oil. When you include electric two- and three-wheelers, which dominate in developing Asia, total EV displacement reaches 1.7 to 2.3 mb/d. That is a meaningful volume, roughly equivalent to Japan’s entire transport oil demand, but it is still less than 2.5% of a 104 mb/d system.
The bulk of avoided consumption does not come from Teslas in California. It comes from the rapid electrification of mopeds, scooters, and motorcycles in Asian cities, where charging infrastructure is less of a barrier. These smaller vehicles accounted for about 1 mb/d of displacement as early as 2021.
The IEA projects EVs will displace more than 5 mb/d by 2030, with electric light-duty vehicles driving 77% of that. In its Stated Policies Scenario, more than 840 million EVs displace 10 mb/d by 2035. The math is straightforward: if 58 million EVs displace about 1 mb/d today, displacing 10 mb/d requires a fleet roughly 15 times larger.
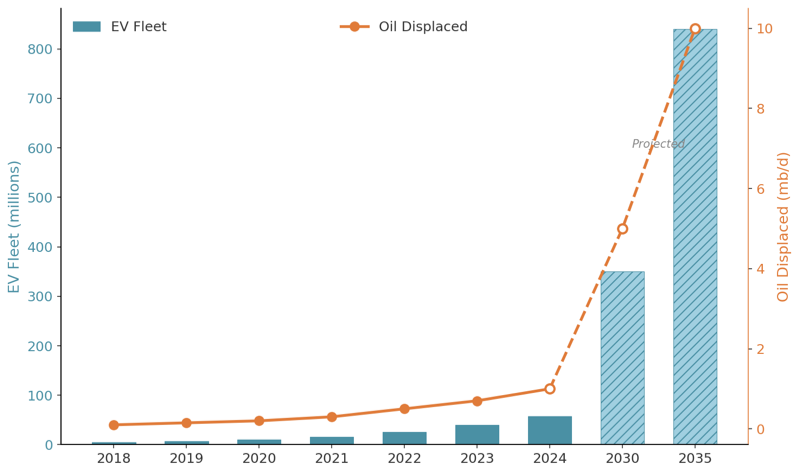 Global EV fleet size and oil displaced. 2030 and 2035 values are IEA projections (Stated Policies Scenario).
Stats By Country
China nearly half of all new cars sold in China in 2024 were electric. About one in ten cars on the road is now electric. China’s gasoline demand fell for the first time in two decades in 2024. By 2030, China alone is expected to account for half of the 5 mb/d displaced by EVs globally.
Norway leads in penetration: 88% of new car sales were battery-electric in 2024. But Norway has fewer than 3 million cars. Its absolute impact on global oil demand is negligible.
Europe is making progress, with about one in twenty cars now electric. Brazil takes a different route, using biofuels and flex-fuel vehicles to reduce oil dependence.
The United States remains deeply car-dependent. Heavy reliance on passenger trucks and SUVs, combined with a slowdown in EV sales growth, has kept gasoline demand firm. EV sales were roughly 10% of the market in 2024.
The countries most dependent on oil for transport are typically those with large road shares, low electrification, limited rail, and rapid economic growth. The IEA projects that non-OECD nations will account for all additional global oil demand growth through 2030, driven by India, which is adding roughly 1 mb/d, and by broad expansion across Southeast Asia, Latin America, and Africa.
Oil in power generation
Oil’s role in electricity is one of the few real success stories in energy substitution. At its peak around 1973, oil generated approximately 25% of the world’s electricity. Today that figure is roughly 2.5%, a 90% reduction in share over five decades. The 1973 oil embargo and the 1979 crisis triggered rapid substitution toward nuclear and natural gas. The first halving, from 25% to about 12%, took only 13 years.
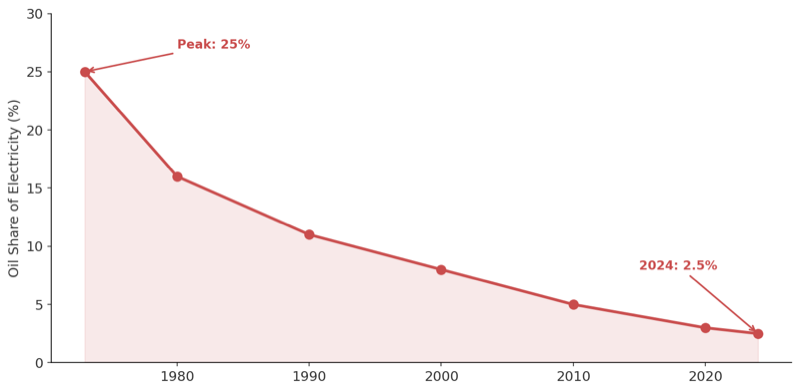 Oil’s share of global electricity generation, 1973 to 2024. The 1973 embargo and 1979 crisis drove the sharpest substitution.
For context, today’s global electricity mix is roughly 35% coal, 22% natural gas, 14% hydro, 9% nuclear, 8% wind, 7% solar, and about 2.5% oil and other fossil fuels. Renewables plus nuclear now supply 40.9% of global electricity, crossing 40% for the first time in 2024, according to Ember’s Global Electricity Review.
Where oil still powers the grid
Global averages hide the tail. Oil clings to electricity generation in specific pockets.
The Middle East is the most prominent case. Ember reports that only 7% of the Middle East’s electricity came from clean sources in 2023. Gas and oil dominate, with gas at 72% and oil filling much of the rest. Saudi Arabia generates roughly 34.5% of its electricity from oil, burning up to 1.4 mb/d of crude during summer peak months, making it the world’s largest user of oil for power generation. Kuwait is at about 46.7% oil, and Iraq about 40.7% (Our World in Data, 2025).
Island nations face extreme dependence. Comoros, Gambia, Nauru, and Timor-Leste generate 100% of their electricity from oil. Caribbean and Pacific island nations typically pay $0.20 to $0.50 per kilowatt-hour for diesel-generated power, compared with the U.S. average of $0.13.
In advanced economies, oil’s share declined faster than many anticipated, but complete eradication has proven difficult. Oil-fired peaker plants, often decades old, are maintained as emergency backstops for grids increasingly reliant on intermittent renewables. Because liquid fuels can be stored onsite and these plants ramp up quickly, they act as reliability insurance. As grid stress increases, some of these plants are seeing their operating lives extended rather than retired.
The production landscape
The geopolitical map of oil production has transformed since the 1970s. The shale revolution turned the United States from a declining producer into the world’s largest. But the concentration of power remains stark: five of the top ten producers sit along the Persian Gulf.
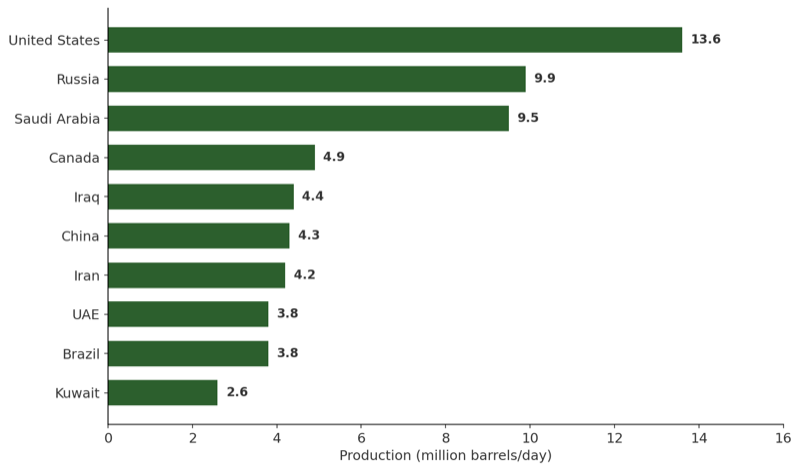 Top 10 crude oil producers, 2025 annualized. Data: U.S. EIA.
The United States produced about 5 mb/d as recently as 2008, a nadir after decades of conventional decline. Hydraulic fracturing and horizontal drilling in the Permian Basin and other shale formations more than doubled output. The U.S. became the world’s largest producer around 2017 and a net petroleum exporter by 2024, with crude exports hitting a record 4.5 mb/d in late 2023. The U.S. Energy Information Administration (EIA) reports that in 2024, more than 15,000 new wells came online, producing 4.4 mb/d of crude, enough to overcome declines from existing wells.
Brazil and Canada have surged into the top ranks on the back of deep-water pre-salt wells and Alberta oil sands. Meanwhile, Venezuela, which holds the world’s largest proven reserves at 303 billion barrels, has seen production collapse from more than 3 mb/d to under 1 mb/d due to PDVSA mismanagement and sanctions.
OPEC vs. non-OPEC
During the 1970s crises, the Organization of the Petroleum Exporting Countries (OPEC) commanded roughly 50% of global production. That dominance eroded as North Sea, Alaskan, and Gulf of Mexico production grew, and it fractured further with U.S. shale. In 2024, countries outside OPEC accounted for 65% of global crude oil production. Non-OPEC+ supply grew by 1.8 mb/d in 2024, driven almost entirely by the Americas.
To regain leverage, OPEC allied with Russia and other producers in 2016 to form OPEC+. The expanded alliance controls approximately 46% to 50% of global crude production and holds most of the world’s spare capacity. But non-OPEC growth keeps applying pressure.
Who actually owns the oil
There is a disconnect between the public image of “Big Oil” and the reality of resource ownership. The publicly traded supermajors, ExxonMobil, Shell, BP, Chevron, and TotalEnergies, control less than 13% of global oil and gas production and reserves.
The true giants are national oil companies (NOCs). Saudi Aramco, NIOC (Iran), CNPC (China), ADNOC (Abu Dhabi), and Rosneft (Russia) sit atop the vast majority of the world’s oil. A Natural Resource Governance Institute report notes that the World Bank has estimated that NOCs control up to 90% of global reserves. OPEC members alone hold 79.1% of global proven crude reserves, about 1,241 billion barrels out of 1,567 billion total (OPEC Annual Statistical Bulletin 2025).
This creates a fundamental asymmetry. NOCs own the cheapest, most abundant reserves. The supermajors use technology and capital to punch above their weight in complex projects, refining, and distribution. But NOCs are closing the downstream gap too. China now processes 19 mb/d of refining capacity. Saudi Aramco is building mega-refineries in India.
How it moves around the world
The global economy requires the continuous movement of more than 104 million barrels per day. Approximately 80 million barrels travel by sea, flowing through a handful of chokepoints that represent extraordinary concentrations of risk.
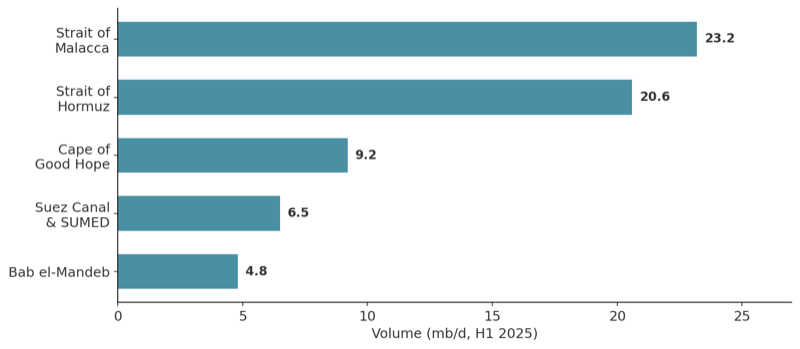 Major oil transit chokepoints by volume, H1 2025. Data: U.S. EIA.
The Strait of Malacca, linking the Indian Ocean to the Pacific, is the busiest oil chokepoint. China takes roughly 48% of the oil passing through it. The Strait of Hormuz handles about 20% of global oil consumption. Only Saudi Arabia and the UAE have pipeline alternatives that bypass it. The Suez Canal and SUMED pipeline normally handle 8 to 9 mb/d.
Major pipeline arteries include the ESPO pipeline, which delivers roughly 700,000 barrels per day (b/d) of Russian crude to China; the Keystone system, which moves up to 830,000 b/d of Canadian crude to U.S. Gulf Coast refineries; and the Druzhba pipeline, the Cold War-era network stretching 4,000 km that once moved 1.2 to 1.4 mb/d from Russia into Central Europe, now partially severed by sanctions and conflict.
What happens when a chokepoint breaks
Suez Canal, March 2021. The container ship Ever Given blocked the canal for six days, delaying more than 430 vessels. Oil prices spiked, though existing inventories buffered the short-term impact.
Red Sea, 2024 onward. Houthi attacks on shipping forced a massive rerouting. The EIA reported that crude and product flows around the Cape of Good Hope increased from 6.0 mb/d in 2023 to 9.2 mb/d in the first eight months of 2024. The rerouting added two weeks and roughly $1 million in fuel per round trip. Tanker rates from the Middle East to Europe tripled. As of early 2026, Suez traffic remains at historically low levels.
Oil does not vanish when a chokepoint breaks. The system reroutes. But rerouting consumes time, capital, and tanker capacity, and it raises prices for everyone.
March 2026: the strait closes
And then came the scenario that energy analysts have war-gamed for decades.
The 2026 regional conflict in the Middle East led to a near-total shutdown of oil transit through the Strait of Hormuz, with traffic falling to less than 10% of pre-war levels.
The price response was violent. Brent crude jumped 15% to $83 by March 5, then surged past $100 on March 8 for the first time in four years. It hit nearly $110 on March 18. Dubai crude, the pricing benchmark for Asian buyers, spiked above $150. Brent has risen roughly 80% since the conflict began. U.S. gasoline prices climbed nearly 80 cents in three weeks, with diesel approaching $5 a gallon. California gasoline breached $5.
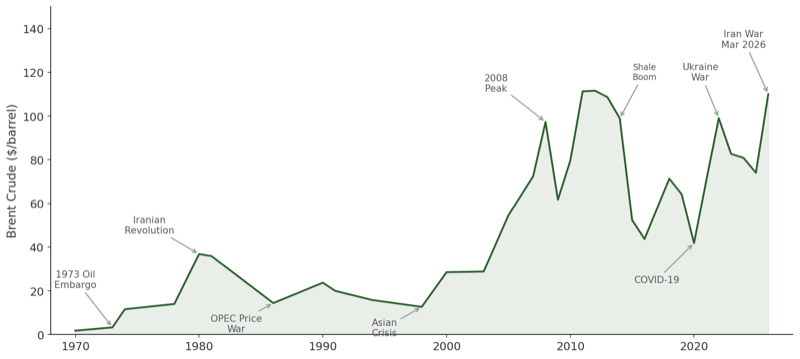 Brent crude annual average price, 1970 to 2026. The March 2026 Middle East conflict spike is the latest in a pattern of geopolitical shocks. Data: FRED, EIA.
The disruption is the largest to global energy supply since the 1973 oil embargo. The Suez blockage delayed ships for six days. The Houthi rerouting added two weeks per voyage. The Hormuz closure removed roughly 20 mb/d from global transit, nearly one fifth of all oil consumed worldwide.
Asia is bearing the worst of it. Eighty-four percent of the oil and 83% of the Liquefied Natural Gas (LNG) shipped through the Strait of Hormuz in 2024 was bound for Asia. Japan, South Korea, India, and Taiwan are almost entirely dependent on seaborne energy imports. Strategic petroleum releases are being discussed, but as the data from 2022 showed, reserves can calm markets temporarily. They cannot replace 20 mb/d of transit capacity.
The crisis does not change the structural analysis in this post. It confirms it. Every vulnerability described here, the transport dependence, the chokepoint concentration, the asymmetry between NOCs and supermajors, the limits of strategic reserves, has been activated simultaneously. The energy transition is real, but it did not arrive fast enough to make this crisis manageable. That is what 104 mb/d of dependence looks like when the system is tested.
Who controls production and distribution
The pricing and movement of oil are governed by a combination of sovereign cartels, independent drillers, government stockpiles, and secretive commodity merchants.
OPEC+ and the swing producer
OPEC+, the 22-member alliance of OPEC nations plus Russia and other partners, has maintained 5.86 mb/d in collective production cuts since 2022, roughly 5.7% of global demand. Saudi Arabia shoulders the largest share, voluntarily cutting 1 mb/d and maintaining an estimated 3 to 3.5 mb/d of spare capacity, roughly 60% of global spare capacity. This gives Saudi Arabia its role as swing producer: the ability to flood or starve the market within 30 to 90 days.
A March 2026 OPEC statement confirmed that eight countries had previously announced additional voluntary adjustments totaling 1.65 mb/d and described a production adjustment of 206,000 b/d for April 2026 as part of unwinding those cuts.
If OPEC+ is the demand-management story, U.S. shale is the supply-curve disruptor. The EIA reports that in 2024, U.S. crude production averaged a record 13.1 mb/d. But shale is not pure flexibility. Individual wells decline quickly, so the system needs continuous drilling to sustain output. More than 15,000 new wells came online in 2024 just to keep production from falling. “Fast” supply is also maintenance-heavy supply.
Shale producers respond to price signals rather than coordinated agreements. When prices rise, rigs spin up; when they fall, activity drops. This creates a de facto price ceiling that constrains OPEC+’s ability to push oil above roughly $80 to $90 per barrel for extended periods.
The invisible giants: trading houses
The physical oil trade is dominated by a handful of private commodity trading houses that most people cannot name.
| Company | HQ | 2024 Revenue | Notable Scale |
|---|---|---|---|
| Vitol | Rotterdam | $331 billion | 7.2 mb/d traded |
| Trafigura | Singapore | $166 billion | 7.6 mb/d (FY2025) |
| Gunvor | Geneva | $136 billion | |
| Glencore | Zug | ~$220 billion | Also mines metals, coal |
| Mercuria | Geneva | ~$100 billion |
These firms lease the tankers, secure the credit, blend crude grades, and execute geographic arbitrage across every basin. They remain invisible because most are privately held, with no obligation to publish results. They operate between producers and refiners, not at the consumer level.
Sanctions
After the EU banned Russian crude in late 2022, China and India absorbed roughly 90% of Russia’s seaborne exports. Russia’s share of India’s crude imports surged from under 1% to 35.8% in fiscal 2024-25. India saved an estimated $10 to $25 billion by buying discounted Russian crude.
A parallel shadow fleet of roughly 200 aging tankers now operates outside Western insurance and regulatory frameworks, using Automatic Identification System (AIS) blackouts, ship-to-ship transfers, and complex ownership structures. Iran exports about 1.5 to 1.8 mb/d to China through similar networks. In 2025, approximately 17% to 18% of China’s oil imports came from sanctioned Iranian and Venezuelan sources at steep discounts, processed largely by independent teapot refineries.
The AI data centers
Data centers did not create oil dependence. But they may shape what comes next by changing electricity demand growth, grid investment, and the politics of energy reliability.
The IEA estimates data centers consumed about 415 terawatt-hours (TWh) of electricity in 2024, around 1.5% of global consumption. It projects demand could more than double to 945 TWh by 2030, roughly equivalent to Japan’s total electricity consumption. Goldman Sachs estimates a 165% increase in data center power demand by 2030. S&P Global projects that global data center capacity could reach 200 GW by 2030, effectively doubling in five years. In the U.S. alone, data center demand is projected to rise from about 62 GW in 2025 to 134 GW by 2030.
The concentration is striking. The United States accounts for about 45% of data center electricity use, China about 25%, and Europe about 15%. In the U.S., data centers could account for nearly half of all new electricity demand growth through 2030.
The scale of money pouring in
The numbers are staggering. Hyperscaler capital expenditure is projected to exceed $600 billion in 2026, a 36% jump from 2025. The four largest spenders alone, Amazon, Google, Microsoft, and Meta, are approaching $700 billion combined. Roughly 75% of this is tied directly to building out the infrastructure to train and serve large language models (LLMs) and other models, not traditional cloud workloads.
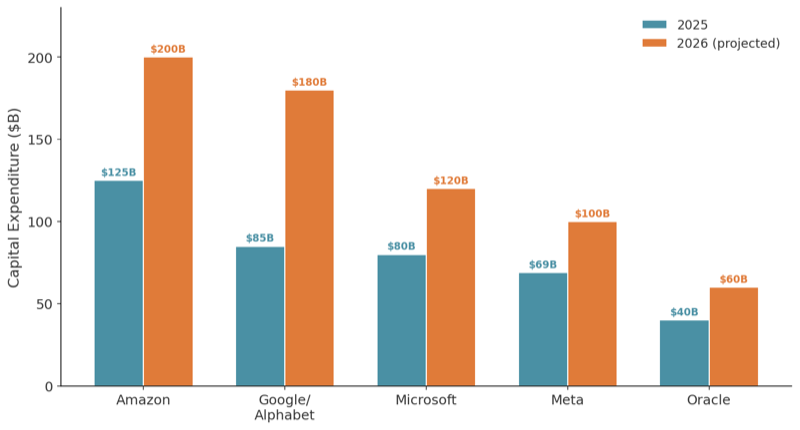 Hyperscaler capital expenditure, 2025 vs. 2026 projected. Data: company earnings guidance, IEEE ComSoc, CNBC.
| Company | 2025 CapEx | 2026 CapEx (projected) |
|---|---|---|
| Amazon | ~$125B | ~$200B |
| Google/Alphabet | ~$85B | ~$175-185B |
| Microsoft | ~$80B | ~$120B |
| Meta | ~$69B | ~$100B |
| Oracle | ~$40B | ~$60B |
To put this in perspective, total global upstream oil and gas investment is about $567 billion. Data center capex now exceeds what the entire oil industry spends to find and extract crude.
The link to fossil fuels
Most data centers run on grid electricity. The first-order connection is between data centers and the power generation mix, not directly between data centers and oil.
But the marginal source of new power is overwhelmingly natural gas. In the United States, gas supplies more than 40% of data center electricity. Goldman Sachs estimates data centers will drive 3.3 billion cubic feet per day of new U.S. gas demand by 2030. U.S. gas-fired power plant projects in development nearly tripled in 2025 (Global Energy Monitor). Morgan Stanley forecasts that U.S. data center demand could reach 74 GW by 2028, with a projected shortfall of about 49 GW in available power access. That gap is being filled predominantly by gas.
The hyperscalers are not just buying grid power. They are directly contracting for and co-developing fossil-fuel generation. The deals announced in 2025 and early 2026 tell the story clearly.
| Project | Partners | Scale | Details |
|---|---|---|---|
| Meta Louisiana data center | Meta / Entergy | 2.3 GW | $10B facility powered by natural gas |
| Stargate initiative | OpenAI / Oracle | 2.3 GW onsite gas (Texas) | Largest onsite gas order ever placed; Oracle’s 5.4 GW lease is the biggest single hyperscale deal recorded |
| Chevron Permian Basin | Chevron | 2.5 GW, expandable to 5 GW | Data center power project in West Texas, announced Nov. 2025 |
| ExxonMobil data center plant | ExxonMobil | 1.5+ GW | Gas plant with 90% carbon capture |
| NextEra/Exxon Southeast campus | NextEra / ExxonMobil | 1 GW | 2,500-acre site near Exxon’s CO2 pipeline infrastructure |
| Chevron / GE Vernova | Chevron / GE Vernova | 4 GW | Gas-powered generation for data centers, 18 to 24 month timeline |
| Google / Intersect Power | Multi-GW | $4.75B acquisition giving Google direct control of energy development | |
| ECP / KKR Texas campus | ECP / KKR | 190 MW (initial) | Co-located with Calpine gas plant, part of $50B partnership |
Globally, 38 GW of captive gas plants are in development specifically for data centers. Under current policy, EPRI models project incremental gas capacity additions of 6.6 to 13.7 GW per year from 2025 to 2030.
Hyperscalers are also chasing nuclear. Microsoft signed a 20-year deal to restart Three Mile Island’s Unit 1 (835 MW). Amazon invested $650 million in a campus near the Susquehanna nuclear plant. Google contracted with Kairos Power for small modular reactors. But nuclear takes a decade to build. Gas plants take two to three years. The near-term reality is fossil power for data centers.
Does data center growth delay peak oil?
Not directly. The primary fossil fuel affected is gas, not oil. But the mechanism is indirect in three ways.
First, massive gas-plant construction creates 30-year infrastructure commitments that lock in fossil-fuel dependence. Second, data center demand strains grids, potentially slowing the electrification of transport and industry, which is the key driver of declining oil demand. Third, in oil-heavy power grids such as those in Saudi Arabia, Kuwait, Iraq, and many island nations, incremental electricity demand can increase oil burn directly.
The IEA expects natural gas and coal to meet more than 40% of additional data center electricity demand through 2030. Oil’s role in power generation is small globally but persistent in specific regions. Data centers reinforce that persistence rather than creating a new direct link to crude.
What the data says about the future
Three major agencies project global oil demand, and they disagree profoundly. The gap is not about details. It is about whether the modern economy fundamentally transforms or barely changes.
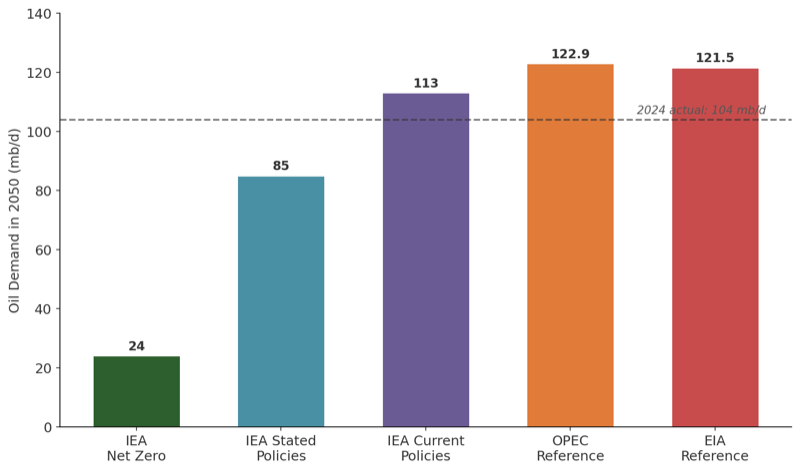 2050 oil demand projections by scenario. The dashed line shows 2024 actual demand at 104 mb/d. Data: IEA WEO 2025, OPEC WOO 2025, U.S. EIA IEO.
The gap between OPEC’s 2050 forecast of 122.9 mb/d and the IEA’s Net Zero scenario of 24 mb/d spans nearly 100 million barrels per day. Two notes before interpreting these numbers. First, definitions differ: the EIA’s “liquid fuels” includes crude oil, petroleum products, natural gas liquids, and biofuels. The IEA and OPEC use different boundaries. Second, scenario choice matters enormously. The IEA itself publishes one scenario in which oil peaks around 2030 and another in which it rises to 113 mb/d by 2050 with no peak. That tells you something about uncertainty.
Why they disagree so sharply
Emerging market growth. The EIA projects India’s liquid fuels consumption rising from 5.0 mb/d in 2022 to 7.3 mb/d in 2030 and 14.3 mb/d in 2050. Asia-Pacific overall goes from 36.0 to 51.7 mb/d by 2050. If you assume this kind of growth, global decline is hard.
EV adoption speed. The IEA assumes rapid EV sales penetration. In its Stated Policies Scenario, 840 million EVs displace 10 mb/d by 2035. If you assume slower rollout, oil stays higher. OPEC projects that internal combustion engine (ICE) vehicles will still account for 72% of the global fleet in 2050.
Aviation and petrochemicals. Both keep growing even in the IEA’s scenarios. Aviation SAF accounts for less than 0.1% of fuel today. Petrochemical feedstocks now account for roughly three quarters of net oil demand growth, and by 2030, plastics and synthetic fibers alone will require more than 18 mb/d. More than one in six barrels pumped will bypass the combustion engine to be cracked into physical goods.
Policy realism. The IEA’s Current Policies Scenario assumes no new climate legislation beyond what is already law. Under that scenario, oil demand reaches 113 mb/d by 2050 with no peak. This maps closely onto OPEC’s projections and represents a world in which political will for transition stalls.
OPEC’s own short-term forecasting record has been poor. It projected 2024 demand growth of 2.3 mb/d. Actual growth came in at 0.84 mb/d. The IEA was closer to reality.
What would it take to halve transport oil dependence by 2040?
That means displacing roughly 25 to 26 mb/d. This is not a slogan. It is a physical restructuring of vehicles, fuels, and infrastructure.
EVs at massive scale. The IEA’s Net Zero scenario requires more than 1 billion EVs on the road by 2040, up from 58 million today. Annual sales would need to reach 60 to 70 million, roughly four times current levels.
Aviation and shipping fuel substitution, starting from near zero. SAF accounts for less than 0.1% of jet fuel. Shipping biofuels account for less than 0.5%. Even ambitious scenarios see meaningful penetration as a 2030s story, not a 2020s story. These sectors require mandates, supply chains, and enormous capital investment in fuels like green ammonia and methanol that barely exist commercially.
Heavy freight electrification or fuel switching. Battery-electric trucks in some corridors, catenary or hybrid systems in others, and limited use of low-carbon fuels where electrification is impractical.
Sustained policy and investment. The IEA estimates total annual energy investment would need to reach $4.8 trillion, versus $3.3 trillion today, sustained for decades. Every major economy would need binding policies: vehicle sales bans, carbon pricing, fleet scrappage programs, all implemented simultaneously.
This is doable in engineering terms. It is extremely difficult in political and investment terms.
If you focus on shares, oil’s dominance is clearly weakening. EVs are growing. Renewables crossed 40% of electricity. Clean energy investment now outpaces fossil-fuel investment 2 to 1.
If you focus on barrels, the picture is less comforting.
Global oil demand rose from approximately 83 mb/d in 2005 to 104 mb/d in 2025, a 25% increase in absolute terms. Both 2023 and 2024 set records, and 2025 moved higher still. Growth is decelerating, from roughly 1.9 mb/d of annual growth in the early 2010s to 0.84 mb/d in 2024. China’s oil demand declined 1.2% in 2024, a potential inflection point. But population growth, rising incomes in India and Southeast Asia, expanding vehicle fleets projected to grow from 1.7 billion to 2.9 billion by 2050, and the near-total oil dependence of aviation and shipping create powerful countercurrents.
The pattern is not decline. It is not quite a plateau. It is deceleration toward a plateau, with the plateau itself still uncertain.
Solar PV investment alone ($450 billion) nearly matches total upstream oil and gas spending ($567 billion). Data center investment ($580 billion) now surpasses oil supply investment. These capital flows signal where the future is heading. But capital flows and barrel counts operate on different timescales. The infrastructure that produces, refines, ships, and burns 104 million barrels per day was built over a century. It will not be unwound in a decade.
The world still runs on oil. That sentence was true in 1975, in 2000, and in 2026. It is painfully true in March 2026, as gasoline prices spike, Asian economies scramble for supply, and 200 tankers circle the Arabian Sea waiting for a strait to reopen.
The question is not whether oil dependence remains in 2035. It will. The question is whether 2025 was the high-water mark, or just another year of incremental growth on the way to something larger, and whether the system built around 104 mb/d can survive the shocks that its own concentration of risk makes inevitable.
The data, for now, does not give us a clean answer.
Sources: IEA World Energy Outlook 2025, IEA Global EV Outlook 2025, IEA Energy and AI Report, Energy Institute Statistical Review 2025, OPEC World Oil Outlook 2025, U.S. EIA International Energy Outlook, U.S. EIA World Oil Transit Chokepoints, Ember Global Electricity Review 2025, Goldman Sachs AI Power Demand Research, Our World in Data, BloombergNEF, Carbon Brief, IPCC AR6 WGIII.